DIY Shortwave Propagation Monitor - Measure Ionosphere Conditions
2026-05-04 | By Mirko Pavleski
License: General Public License Arduino
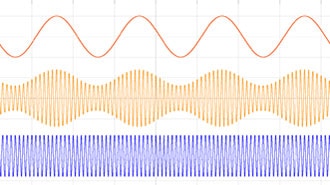
Shortwave propagation is the way radio waves in the 3 to 30 MHz range travel from point A to point B, using the ionosphere as a mirror. The ionosphere is a layer of the atmosphere full of charged particles (ions). The quality of the signal depends on how "dense" this layer is.
This is affected by several factors, such as solar activity (the most important factor), time of day (day or night), seasons, and others. In this project, I will present you with a very simple way to measure the current conditions of the ionosphere and, therefore, the conditions for receiving shortwave signals.
This is an extremely useful tool for SW listeners because, at any moment, with one glance at the instrument, they know what quality of reception they can expect at a given moment. Basically, I'm using an old circuit diagram from Elektor magazine from the 1990s.
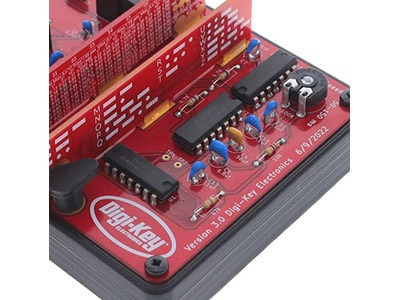
The CA3089 IC is the heart of the device. Although it is designed as an FM intermediate frequency amplifier, it is used here for its broadband amplification capability. It “catches” all signals in a certain range (about 1–30 MHz) at once. Instead of tuning to a single station, it measures the total level of RF energy in the air. This makes it ideal for measuring signal propagation in the SW range. The CA3089 has a built-in RSSI (Received Signal Strength Indicator) circuit, and it is pin 13 that also provides a logarithmic output, which is perfect for a propagation monitor because you will see both the weakest and strongest changes on the scale. I connected an electrolytic capacitor in parallel with the voltage output in order to avoid frequent and sudden changes (jumps and drops) in the voltage, so that the value is relatively constant at a given moment.
The supply voltage should be constant because a lower supply voltage would give a lower value of the output voltage. That's why I use a voltage stabilizer made with an LM317, and it's simpler to use the LM7809 linear stabilizer (I didn't have one at the moment).
At the beginning, I tested with a digital multimeter and an analog instrument (5V voltmeter).
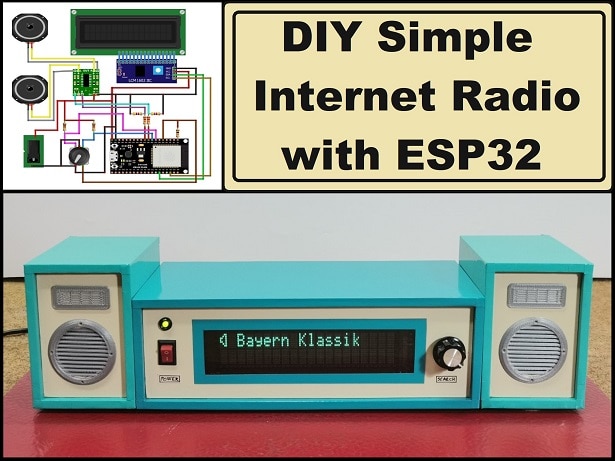
Then I decided to make a small Arduino assembly with an OLED display and to install the complete device in a suitable housing. For even more precise information, in a more advanced version of this device, we can set up two input circuits with different input coils and capacitors for day and night signal propagation or for a certain band.
The device is very simple to make and consists of one IC (CA3089), several passive elements (resistors, capacitors, and inductors), and an output unit that displays the result, which can be a small analog instrument, a multimeter, or, as in my case, an OLED display with Arduino.
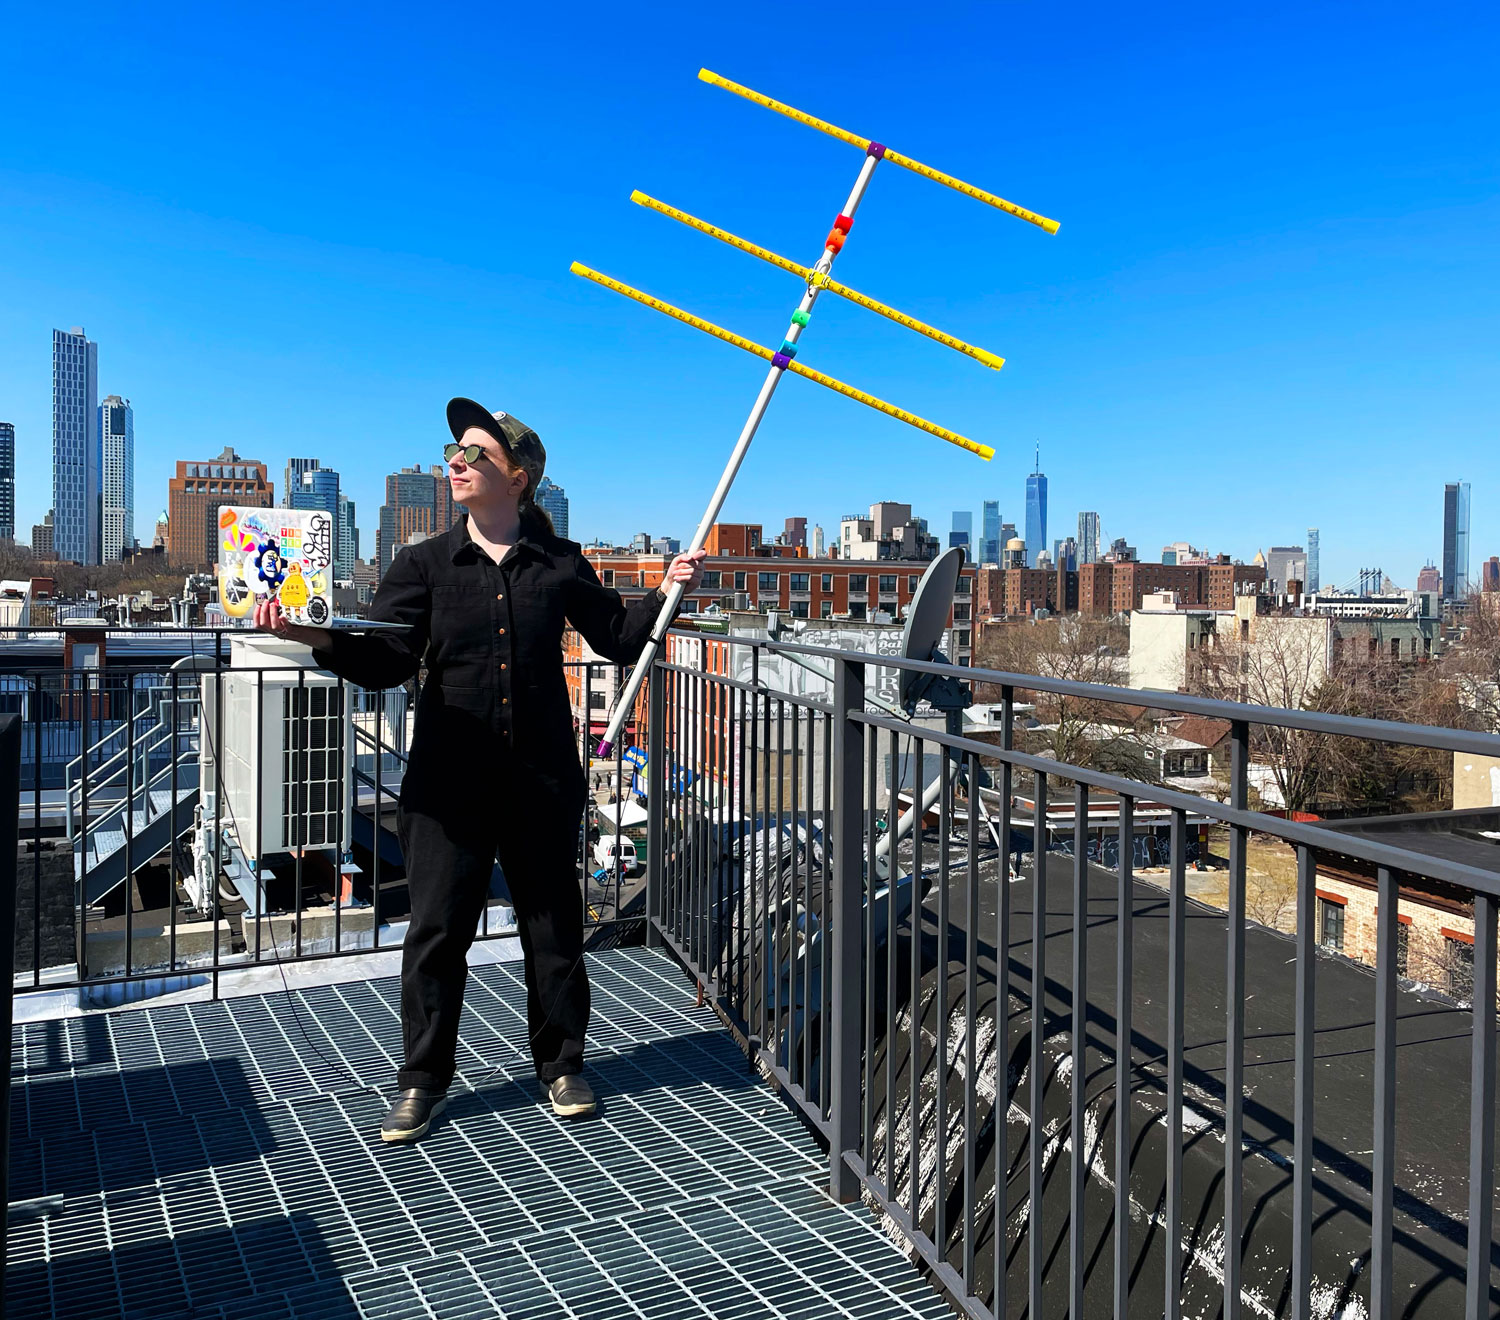
Now, a few words about the setup. For accurate results, it is advisable to always use the same antenna, and it can be a regular wire with a length of one to several meters. Without an antenna connected, the output voltage is low, and it is about 0.6V. If we touch the input with our finger, this voltage should increase (then there is a weak RF signal reception, and this is a sign that the device is functioning normally). Now we connect the antenna and wait for the moment when the signal is strongest (logically, this is at night), and if we use a 5V instrument (like me when testing), with the trimmer potentiometer, we should bring the arrow a little more than half the scale (or about 3V on a multimeter). With this, the setup is complete. Let me just emphasize that globally, the signal has a lower value during the day and a higher one at night. After a few days of comparing the value of the instrument with the real received signal on the radio, we will know for sure when the propagation of the RF signals is bad, good, or excellent, and that at the same moment when we look at the instrument.
In my special case, instead of a voltmeter, I use an Arduino with an OLED display.
If you have experience with Arduino, it is advisable to use this method because you have better visibility of the result (numbers and bars), and also, after a certain time, you can calibrate it by changing the range of the mapped input signal, which will give us even greater precision, i.e., resolution. At the end of the text, the Arduino code is given.
Now let's see how the device works in real conditions: When turning on the display, a Relativity numerical value appears in the middle and a small horizontal bar indicator in the upper part. Currently, without an antenna connected, the value is about 150.
I map the entire input from 0 to 1023, which means that the values on the display from 0 to 1024 correspond to a voltage from 0 to 5V.
At the beginning of the code, there are places where you can set the minimum and maximum expected value of the input signal to get maximum sensitivity.
By connecting an antenna to the input, the bar moves to the right, and the numerical value also changes. In fact, these parameters show us the ability to reflect SW signals in the ionosphere, i.e., SW propagation at that moment. After a short time of using this instrument, I can now notice even minimal changes in the reception conditions in this area.
Of course, as I mentioned earlier, during the day the value is always lower, but with experience, we will know exactly whether the reception conditions are good or bad, regardless of whether it is day or night.
And finally, a short conclusion. This project is an extremely useful tool for any shortwave radio listener, allowing for precise monitoring of changes in the atmosphere. With a few passive elements, you get a professional device for diagnosing radio signals.
//  by mircemk  April, 2026

#include <Wire.h>
#include <Adafruit_GFX.h>
#include <Adafruit_SSD1306.h>

#define SCREEN_WIDTH 128
#define SCREEN_HEIGHT 64
Adafruit_SSD1306 display(SCREEN_WIDTH, SCREEN_HEIGHT, &Wire, -1);

// ---- UI (поголем BOX долу) ----
const int BAR_Y = 2;
const int BAR_H = 12;
const int BAR_X = 2;
const int BAR_W = 124;

const int BOX_X = 6;     // помал margin
const int BOX_Y = 20;    // спуштено нагоре малку
const int BOX_W = 116;   // пошироко
const int BOX_H = 44;    // повисоко (скоро до дното)
const int BOX_R = 8;

// ---- Analog ----
const int ANALOG_PIN = A0;

// ======= РАНГ (ADC) =======
int IN_MIN = 60;
int IN_MAX = 1000;

static inline int clampInt(int v, int lo, int hi) {
  if (v < lo) return lo;
  if (v > hi) return hi;
  return v;
}

static inline int mapLongToInt(long x, long in_min, long in_max, long out_min, long out_max) {
  if (in_max == in_min) return (int)out_min;
  return (int)((x - in_min) * (out_max - out_min) / (in_max - in_min) + out_min);
}

void drawCenteredTextInBox(const char* txt, int textSize) {
  display.setTextSize(textSize);

  int16_t x1, y1;
  uint16_t w, h;
  display.getTextBounds(txt, 0, 0, &x1, &y1, &w, &h);

  int tx = BOX_X + (BOX_W - (int)w) / 2;
  int ty = BOX_Y + (BOX_H - (int)h) / 2;

  display.setCursor(tx, ty);
  display.print(txt);
}

void setup() {
  analogReference(DEFAULT);
  Wire.begin();

  if (!display.begin(SSD1306_SWITCHCAPVCC, 0x3C)) {
    while (1) {}
  }
  display.clearDisplay();
  display.setTextColor(SSD1306_WHITE);
  display.display();
}

void loop() {
  int raw = analogRead(ANALOG_PIN);

  int a = IN_MIN, b = IN_MAX;
  if (a > b) { int t = a; a = b; b = t; }

  int rawWin = clampInt(raw, a, b);

  int rel1000 = mapLongToInt(rawWin, a, b, 0, 1000);
  int barFill = mapLongToInt(rawWin, a, b, 0, BAR_W);

  display.clearDisplay();

  // BAR
  display.drawRect(BAR_X, BAR_Y, BAR_W, BAR_H, SSD1306_WHITE);
  int innerW = barFill - 2;
  if (innerW < 0) innerW = 0;
  if (innerW > BAR_W - 2) innerW = BAR_W - 2;
  display.fillRect(BAR_X + 1, BAR_Y + 1, innerW, BAR_H - 2, SSD1306_WHITE);

  // BOX
  display.drawRoundRect(BOX_X, BOX_Y, BOX_W, BOX_H, BOX_R, SSD1306_WHITE);

  // број (auto size: 0-999 големо, 1000 помало)
  char buf[6];
  snprintf(buf, sizeof(buf), "%d", rel1000);

  int size = (rel1000 >= 1000) ? 3 : 4;  // 1000 да собере
  drawCenteredTextInBox(buf, size);

  display.display();
  delay(1000);
}